<!--********************************************************************
* Copyright© 2000 - 2021 SuperMap Software Co.Ltd. All rights reserved.
*********************************************************************-->
<!DOCTYPE html>
<html>
<head>
    <meta charset="UTF-8">
    <title data-i18n="resources.title_themeGraph"></title>
    <script type="text/javascript" src="../js/include-web.js"></script>
</head>
<body style=" margin: 0;overflow: hidden;background: #fff;width: 100%;height:100%;position: absolute;top: 0;">
<div id="map" style="margin:0 auto;width: 100%;height: 100%"></div>
<script type="text/javascript" src="../../dist/leaflet/include-leaflet.js"></script>
<script type="text/javascript">
    var host = window.isLocal ? window.server : "https://iserver.supermap.io";
    var map, themeService, themeGraph, themeParameters, themeLayer,
        mapUrl = host + "/iserver/services/map-jingjin/rest/maps/京津地区地图",
        url = host + "/iserver/services/map-jingjin/rest/maps/京津地区人口分布图_专题图";
    map = L.map('map', {
        crs: L.CRS.EPSG4326,
        center: [40, 117],
        maxZoom: 18,
        zoom: 6
    });
    L.supermap.tiledMapLayer(mapUrl, {noWrap: true}).addTo(map);
    createTheme();

    function createTheme() {
        themeService = L.supermap.themeService(url);
        themeGraph = new SuperMap.ThemeGraph({
            items: [
                new SuperMap.ThemeGraphItem({
                    caption: "1992-1995人口增长率",
                    graphExpression: "Pop_Rate95",
                    uniformStyle: new SuperMap.ServerStyle({
                        fillForeColor: new SuperMap.ServerColor(92, 73, 234),
                        lineWidth: 0.1
                    })
                }),
                new SuperMap.ThemeGraphItem({
                    caption: "1995-1999人口增长率",
                    graphExpression: "Pop_Rate99",
                    uniformStyle: new SuperMap.ServerStyle({
                        fillForeColor: new SuperMap.ServerColor(211, 111, 240),
                        lineWidth: 0.1
                    })
                })
            ],
            barWidth: 0.03,
            graduatedMode: SuperMap.GraduatedMode.SQUAREROOT,
            graphAxes: new SuperMap.ThemeGraphAxes({
                axesDisplayed: true
            }),
            graphSize: new SuperMap.ThemeGraphSize({
                maxGraphSize: 1,
                minGraphSize: 0.35
            }),
            graphText: new SuperMap.ThemeGraphText({
                graphTextDisplayed: true,
                graphTextFormat: SuperMap.ThemeGraphTextFormat.VALUE,
                graphTextStyle: new SuperMap.ServerTextStyle({
                    sizeFixed: true,
                    fontHeight: 9,
                    fontWidth: 5
                })
            }),
            graphType: SuperMap.ThemeGraphType.BAR3D
        });
        themeParameters = new SuperMap.ThemeParameters({
            themes: [themeGraph],
            dataSourceNames: ["Jingjin"],
            datasetNames: ["BaseMap_R"]
        });
        themeService.getThemeInfo(themeParameters, function (serviceResult) {
            var result = serviceResult.result;
            if (result && result.newResourceID) {
                themeLayer = L.supermap.tiledMapLayer(url, {
                    noWrap: true,
                    cacheEnabled: false,
                    transparent: true,
                    layersID: result.newResourceID
                }).addTo(map);
            }
        });
    }
</script>
</body>
</html>
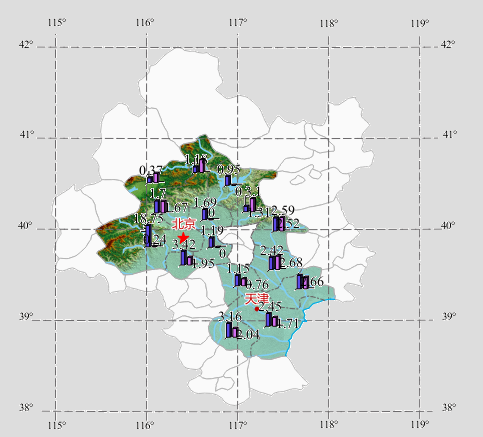
这是示例 运行结果
下边是我自己的 换点了url和dataSourceNames、datasetNames 运行结果就报错 提示
mapUrl = host + "/iserver/services/map-lanling/rest/maps/vector",
url = host + "/iserver/services/map-lanling/rest/maps/vector";


dataSourceNames: ["vector4326"],
datasetNames: ["乡镇统计数据"]

graphExpression: "SmID",
运行结果
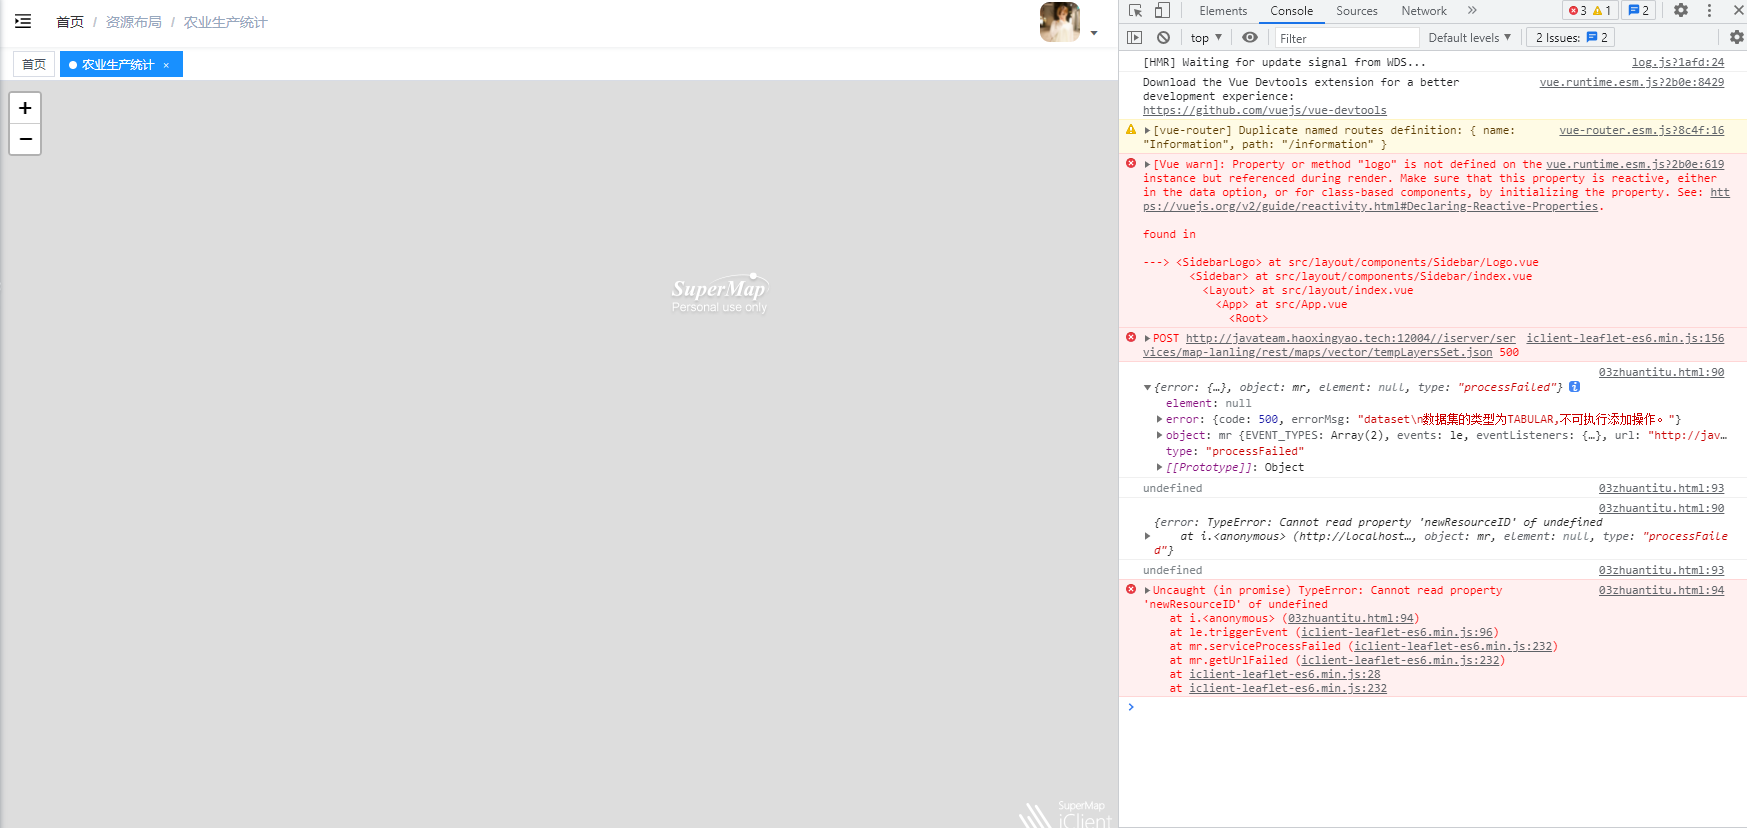 请问 这是什么问题呢