使用产品:idesktop10i leaflet iserve10i 操作系统:win10 x64
数据类型: 文件型
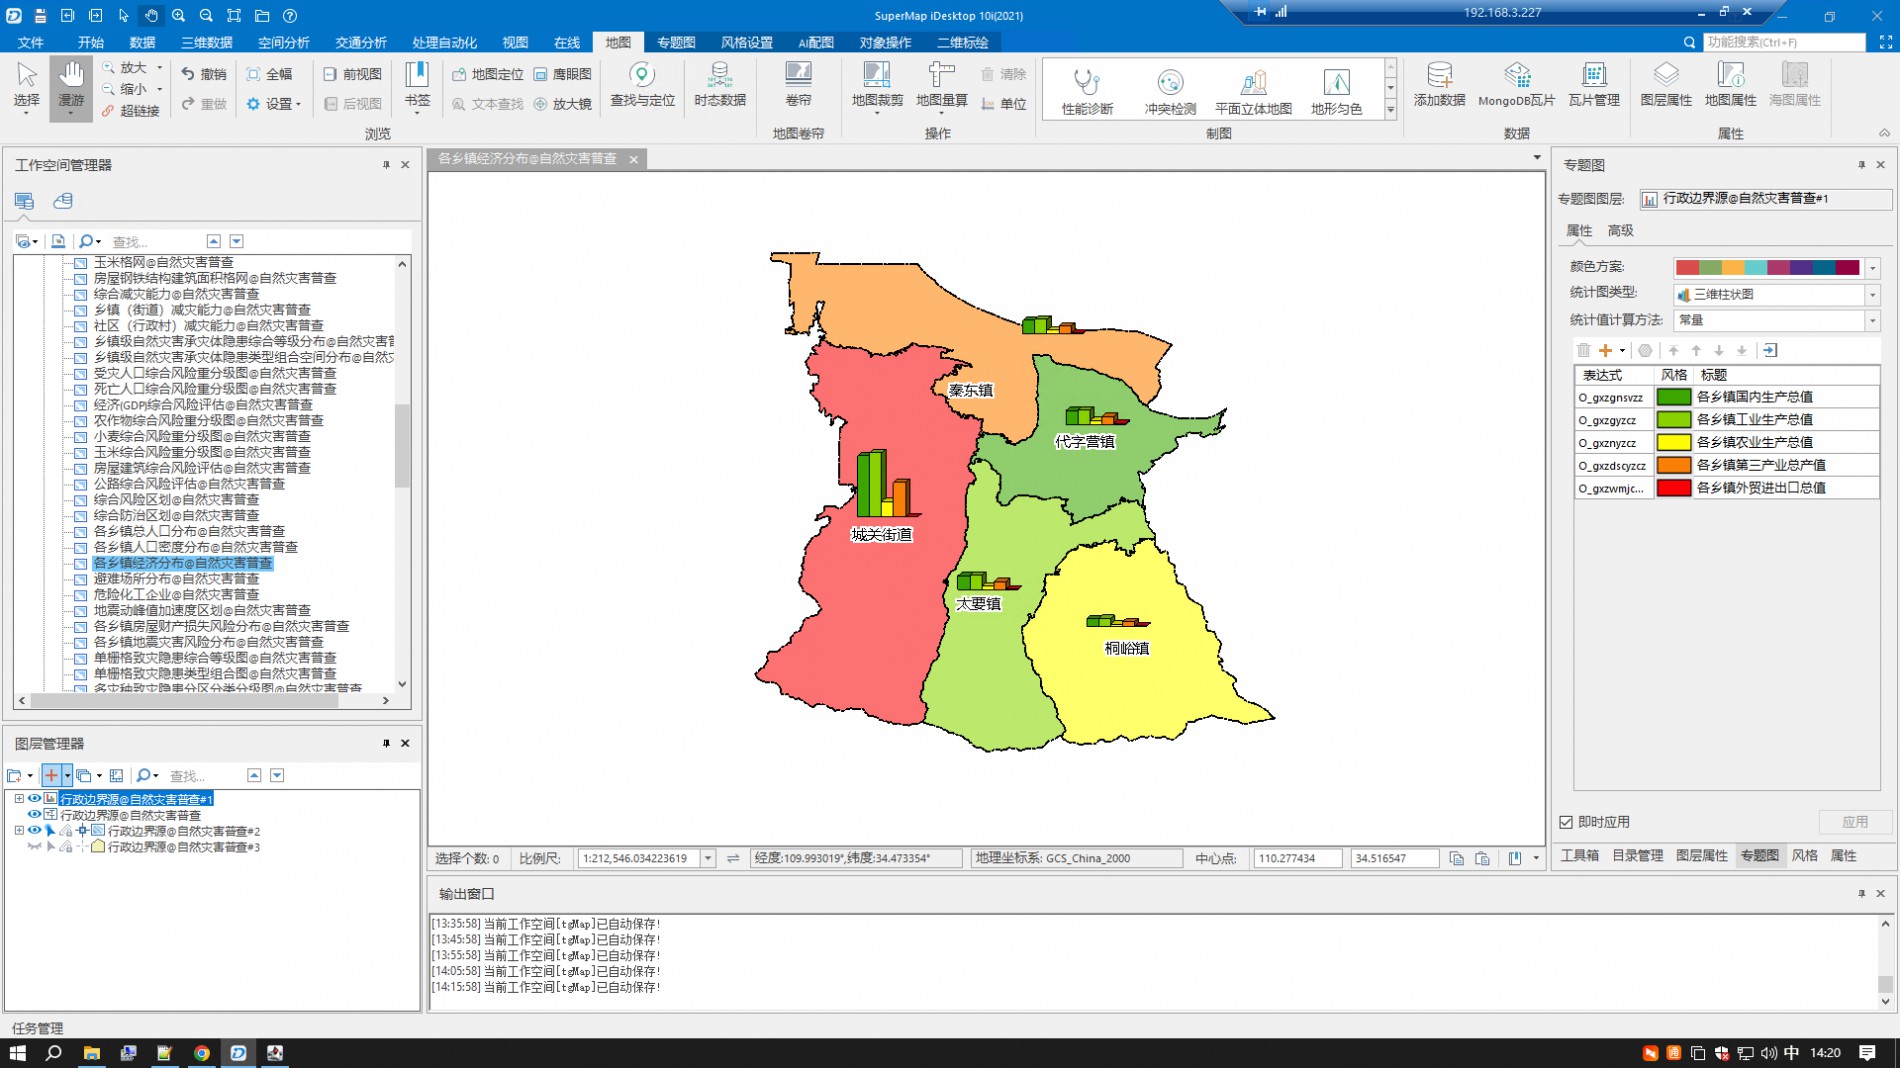
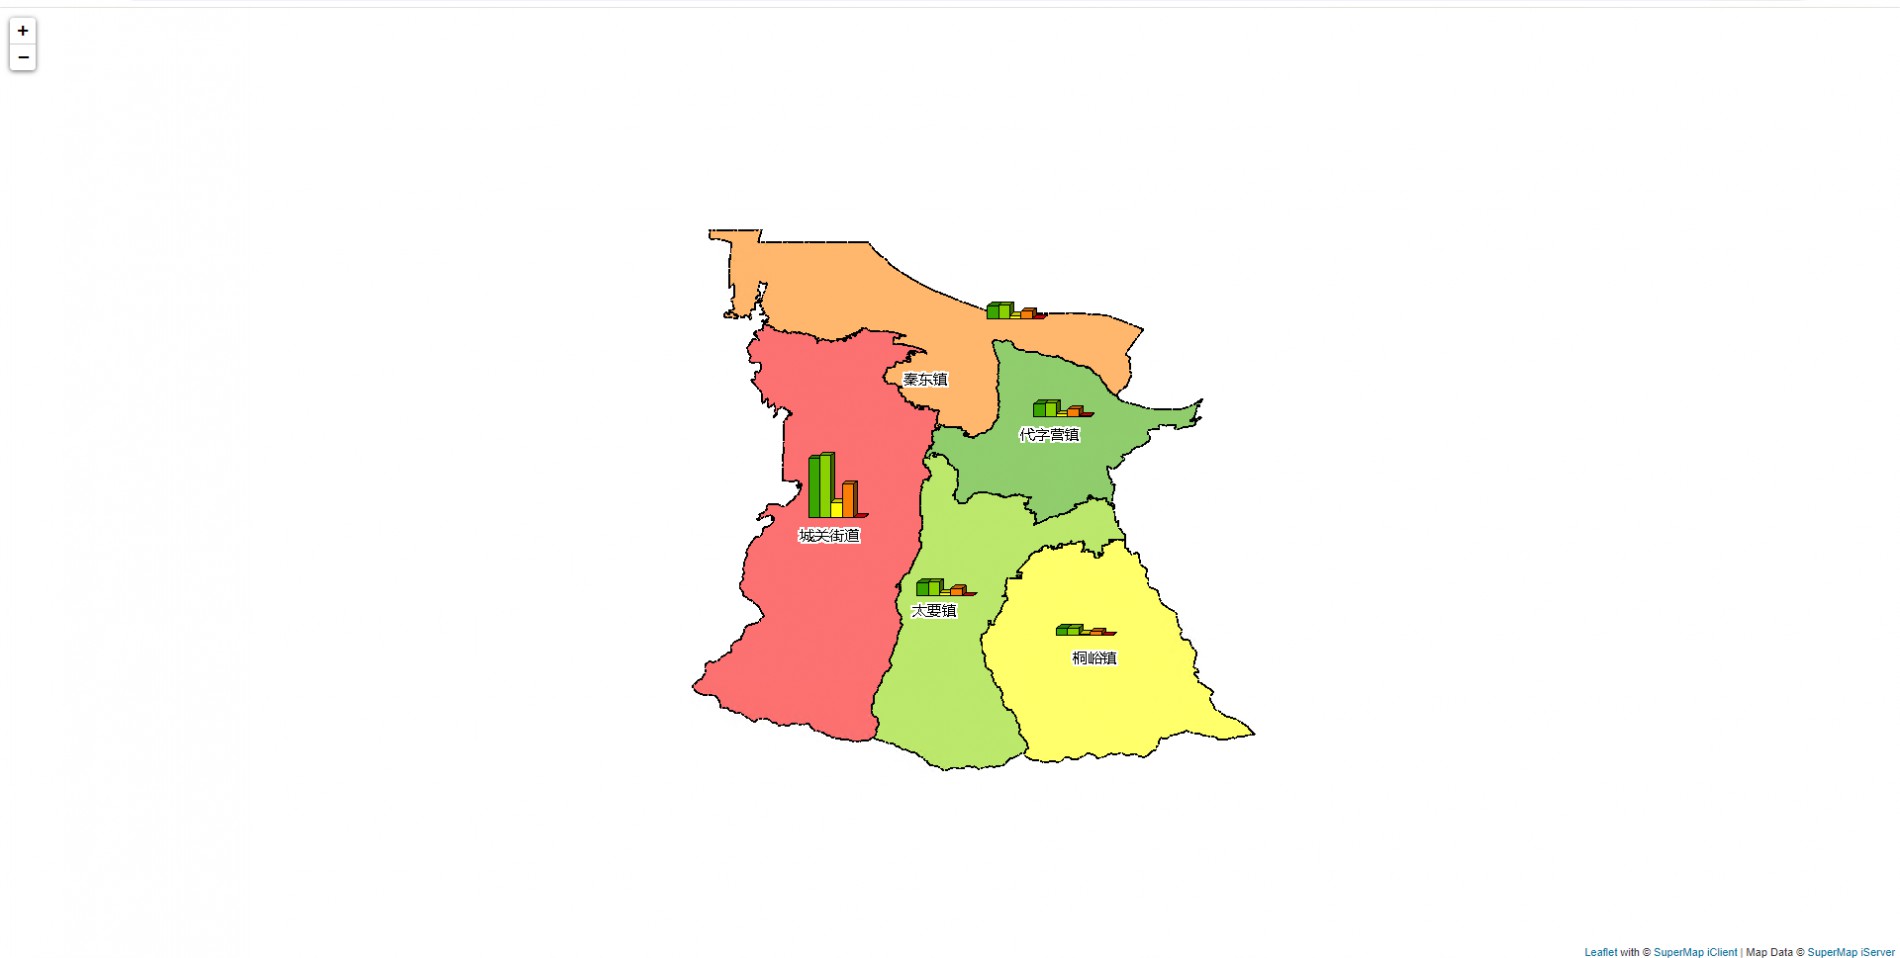
问题详细描述:在idexktop中,通过一个数据集创建了一个三维柱状专题统计图,把工作空间发布以后,通过发布的地图url显示在地图上,但是并未展示柱状图,同一地图上的其他专题图可以正常显示
问题重现步骤:
1.在idesktop上制作专题图
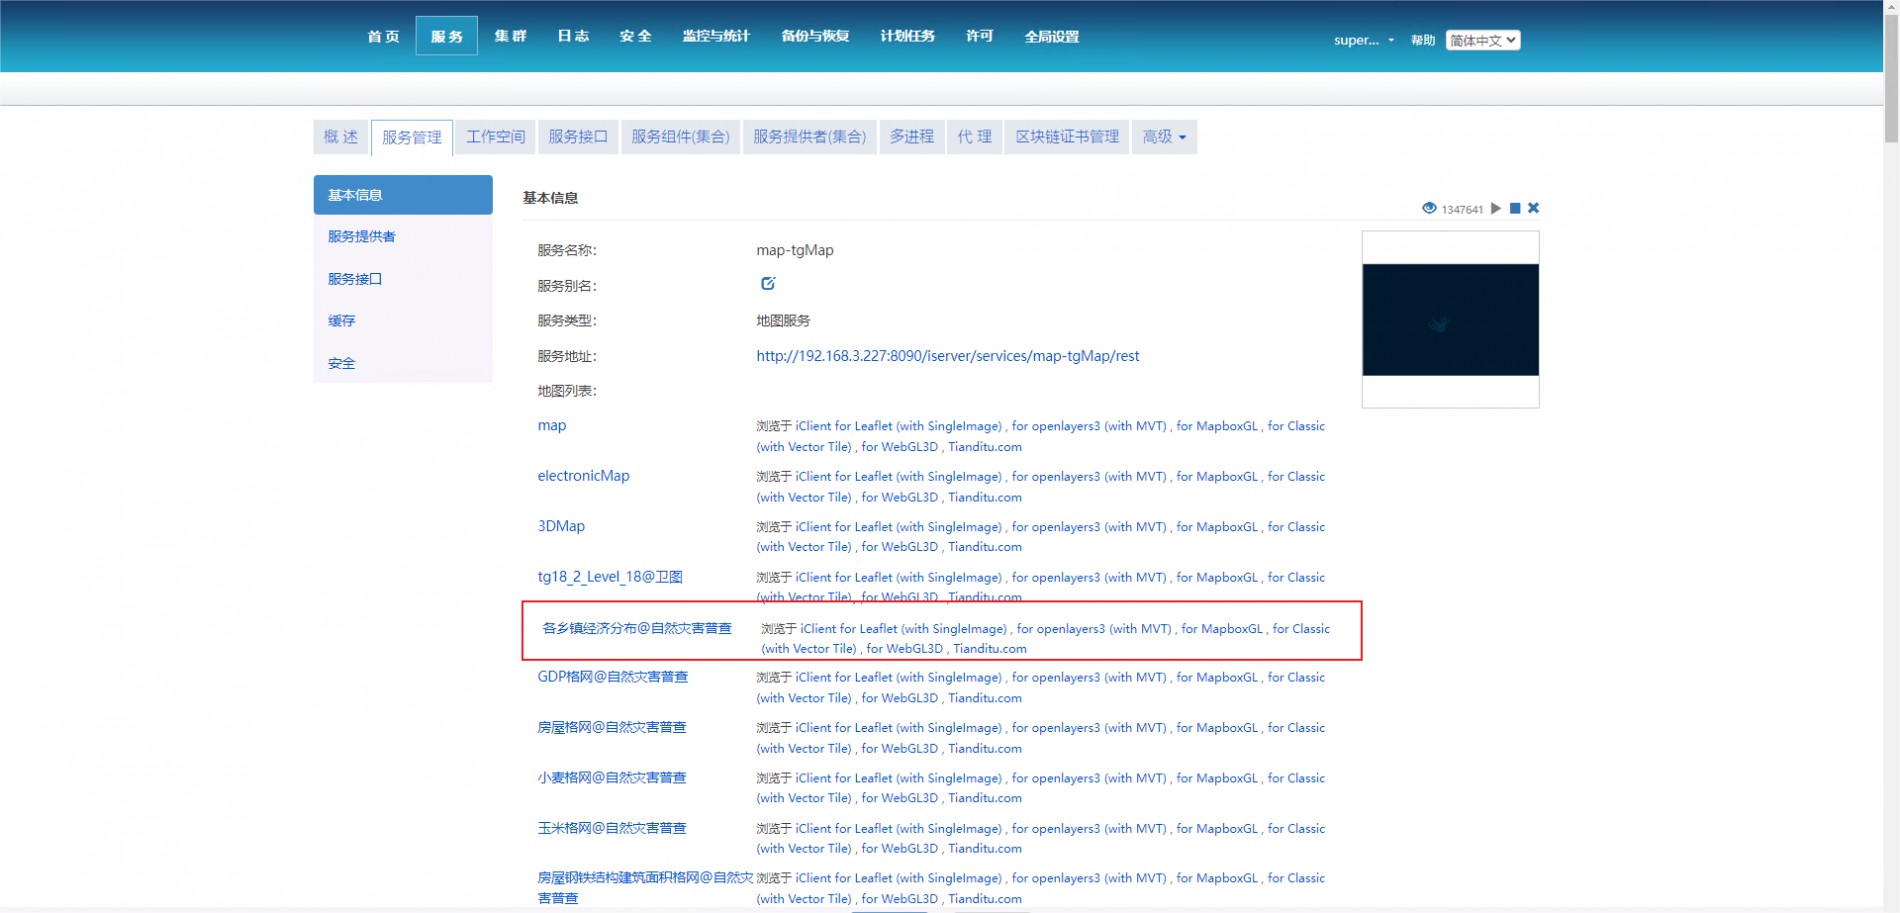
 2.发布:
2.发布:

3.发布后的效果

4.前端代码获取专题图
// 获取专题图层
    getThemeLayer(data) {
      this.legrndSrc = data.legendURl;
      this.clearThemeLayer();
      if (data.id == 8 || data.id == 9 || data.id == 12) {
        this.showDialog = true;
        this.getCensusResults(data);
      } else {
        let url =
          this.$gisJoint.URL_MAP_IP +
          "/iserver/services/map-tgMap/rest/maps/" +
          data.label +
          "@自然灾害普查";
        this.themeLayer = L.supermap.tiledMapLayer(url, {
          // noWrap: true,
          // redirect:true,
          // isLayer: true,
          // // overlapDisplayed:true,
          prjCoordSys: { epsgCode: 3857 },
          // minZoom: 1, // 设置地图的最小缩放级别
          // maxZoom: 18,
        });
        this.themeLayer.setZIndex(20);
        this.themeLayer.addTo(this.map);
        if (data.id == 7) {
          this.getBar(url);
        }
      }
    },
5.结果:只有设置颜色块的单值专题图层 没有柱状图
6.尝试用前端代码的方式从数据集中获取数据生成也失败,代码如下:
// 柱状图
    getBar(url) {
      let that = this;
      let themeService = L.supermap.themeService(url);
      let themeGraph = new SuperMap.ThemeGraph({
        items: [
          new SuperMap.ThemeGraphItem({
            caption: "O_gxzgnsvzz",
            graphExpression: "O_gxzgnsvzz",
            uniformStyle: new SuperMap.ServerStyle({
              fillForeColor: new SuperMap.ServerColor(92,73,234),
              lineWidth: 0.1
            })
          }),
          new SuperMap.ThemeGraphItem({
              caption: "各乡镇国内生产总值",
              graphExpression: "O_gxzgnsvzz",
              uniformStyle: new SuperMap.ServerStyle({
                  fillForeColor: new SuperMap.ServerColor(92, 1, 255),
                  lineWidth: 0.5,
                  lineColor: new SuperMap.ServerColor(92, 1, 255)
              })
          }),
        ],
        barWidth: 1,
        graphSizeFixed:true,
        graphType: SuperMap.ThemeGraphType.BAR3D,
        graduatedMode: SuperMap.GraduatedMode.CONSTANT,
        graphAxes: new SuperMap.ThemeGraphAxes({
          axesDisplayed: true,
        }),
        graphSize: new SuperMap.ThemeGraphSize({
          maxGraphSize: 1,
          minGraphSize: 0.35,
        }),
        graphText: new SuperMap.ThemeGraphText({
          graphTextDisplayed: true,
          graphTextFormat: SuperMap.ThemeGraphTextFormat.VALUE,
          graphTextStyle: new SuperMap.ServerTextStyle({
            sizeFixed: true,
            fontHeight: 9,
            fontWidth: 5,
          }),
        }),
      });
      let themeParameters = new SuperMap.ThemeParameters({
        themes: [themeGraph],
        dataSourceNames: ["自然灾害普查"],
        datasetNames: ["行政边界源"],
      });
      console.log(
        "themeParametersthemeParametersthemeParameters",
        themeParameters
      );
      themeService.getThemeInfo(themeParameters, function (serviceResult) {
        var result = serviceResult.result;
        if (result && result.newResourceID) {
          let themeLayer = L.supermap.tiledMapLayer(url, {
            noWrap: true,
            cacheEnabled: false,
            transparent: true,
            layersID: result.newResourceID,
            prjCoordSys: { epsgCode: 3857 },
          });
          themeLayer.setZIndex(30);
          themeLayer.addTo(that.map);
          console.log(that.map);
        }
      });
    },

 热门文章
热门文章


